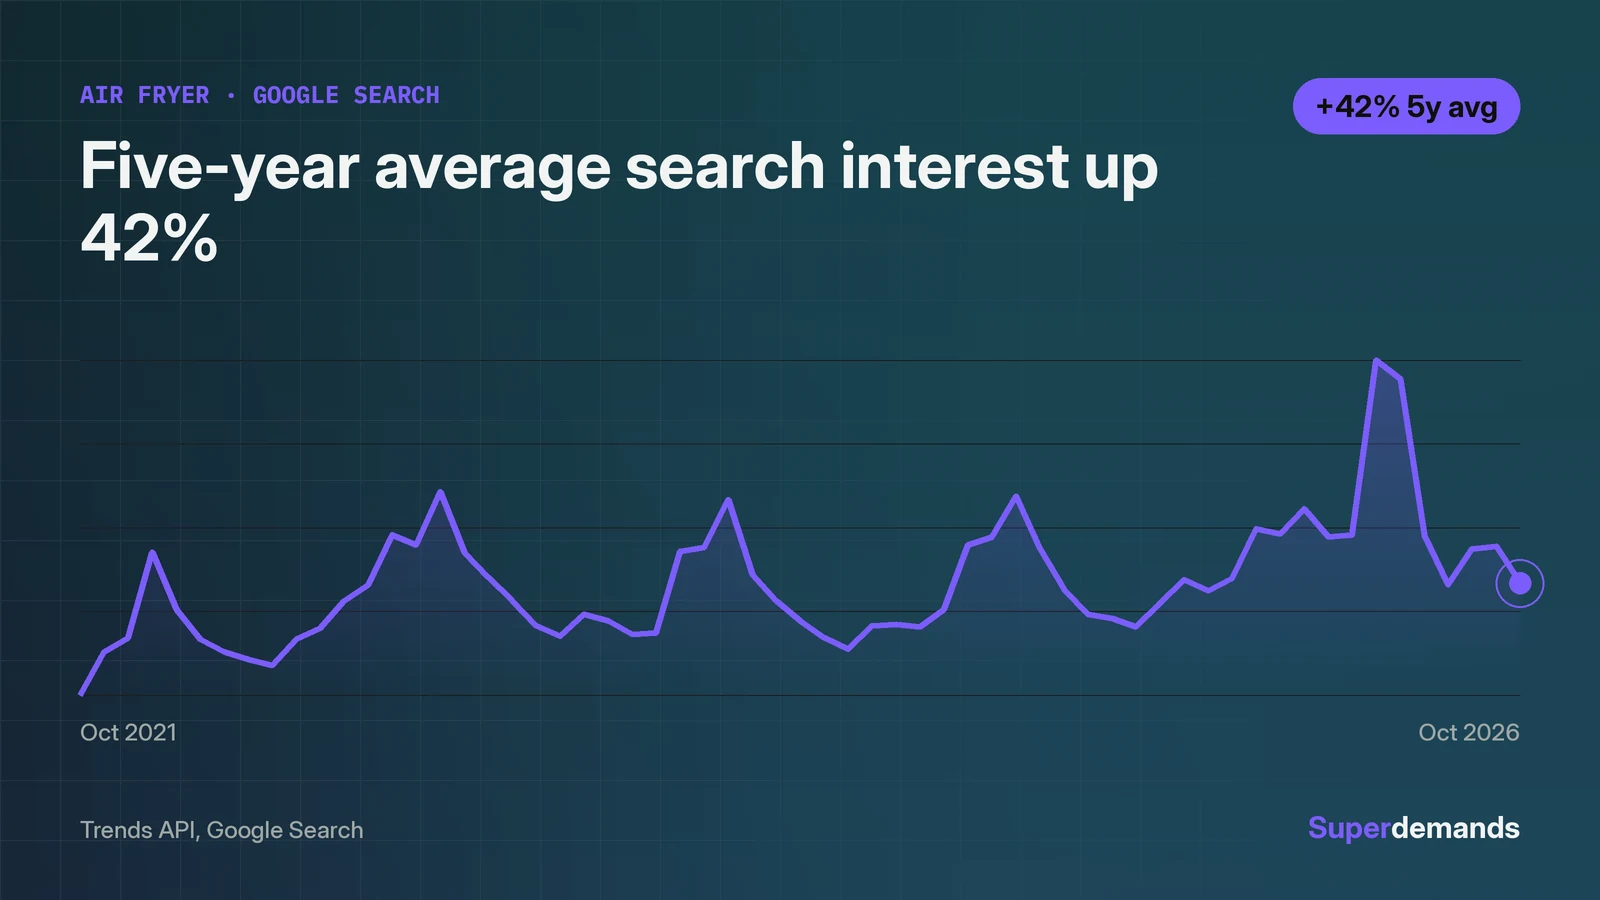
Air fryer demand is durable, not explosive. The average weekly Google Search index rose 42% over five years, from 43.9 in the first 52 weeks to 62.4 in the last 52. The most recent twelve months are flat: the index stands at 51 for the week of October 17, 2026, down 1.9% from a year earlier, while Google Keyword Planner puts the keyword at about 4.09 million monthly searches. Amazon demand grew 3.1% in the year to September 30, 2026, then cooled 12.6% over the last three months of that window, a seasonal fade rather than a collapse. The honest read: a mature category growing slowly, with each year setting a slightly higher floor.
The five-year climb is steady, not sudden
There is no hockey stick here. The yearly averages tell the whole story:
| Period | Average weekly index |
|---|---|
| 2022 | 47.1 |
| 2023 | 49.8 |
| 2024 | 48.9 |
| 2025 | 52.2 |
| January to October 2026 | 63.2 |
January to October 2026 averages 24.8% above the same months of 2025 (50.7), which is where the five-year gain is coming from: not a breakout, but a stronger 2026 overall. The series peak, an index of 100, landed in the week of May 9, 2026.
Seasonality runs through the whole series. January averages 62.5, the strongest month of the year, and November and December sit near 55, well above June's 44.5. People shop for air fryers when the holidays and new-year cooking push them to, and interest troughs in early summer. See how these figures are built on the methodology page.
Google is flat while Amazon keeps buying
The last twelve months split the two sources. Google search interest fell 1.9% year over year and rose 2.0% over three months, which is flat by any honest measure. Amazon search volume for air fryers rose 3.1% in the year to September 30, 2026 (index 57.9 to 59.7) but fell 12.6% over the last three months of that window (68.3 to 59.7).
Two caveats apply. The Amazon series ends a month before the Google one, so October buying is not in it yet, and the three-month fade is largely the summer peak rolling off. And TikTok returned no data for this keyword, so short-video demand is a gap in this picture.
The volume-weighted read across Google and Amazon is a 7.3% decline over three months, driven by Amazon's seasonal fade. Raw size keeps it in perspective: the latest Google week carries an estimated 3.66 million searches, Amazon another 6.47 million, a combined 10.1 million a week.
The lead over rival appliances is enormous
Pressure cookers are growing faster in relative terms, up 87.9% over the same five-year window, and toaster ovens up 82.5%. But those gains come from far lower bases. The latest estimated weekly Google volume is 3.66 million for air fryers against 273,000 for pressure cookers, roughly thirteen to one. Toaster oven volume was not reported by the source at all.
A note on reading the indexes: each keyword's index is normalized to its own peak, so index values cannot be compared across keywords. The volume estimates are the comparison, and they show a category where the leader's growth is modest but its absolute lead barely moves.
What would change this reading
The durable-demand reading fails if Amazon's October to December data drops the way the three-month fade suggests rather than rebounding into the holiday peak. A sign it holds: another January step in early 2027 that starts from above the 51 of October 2026.
For other kitchen appliances on similar curves, the movers list shows which ones are still rising and which have already rolled over.