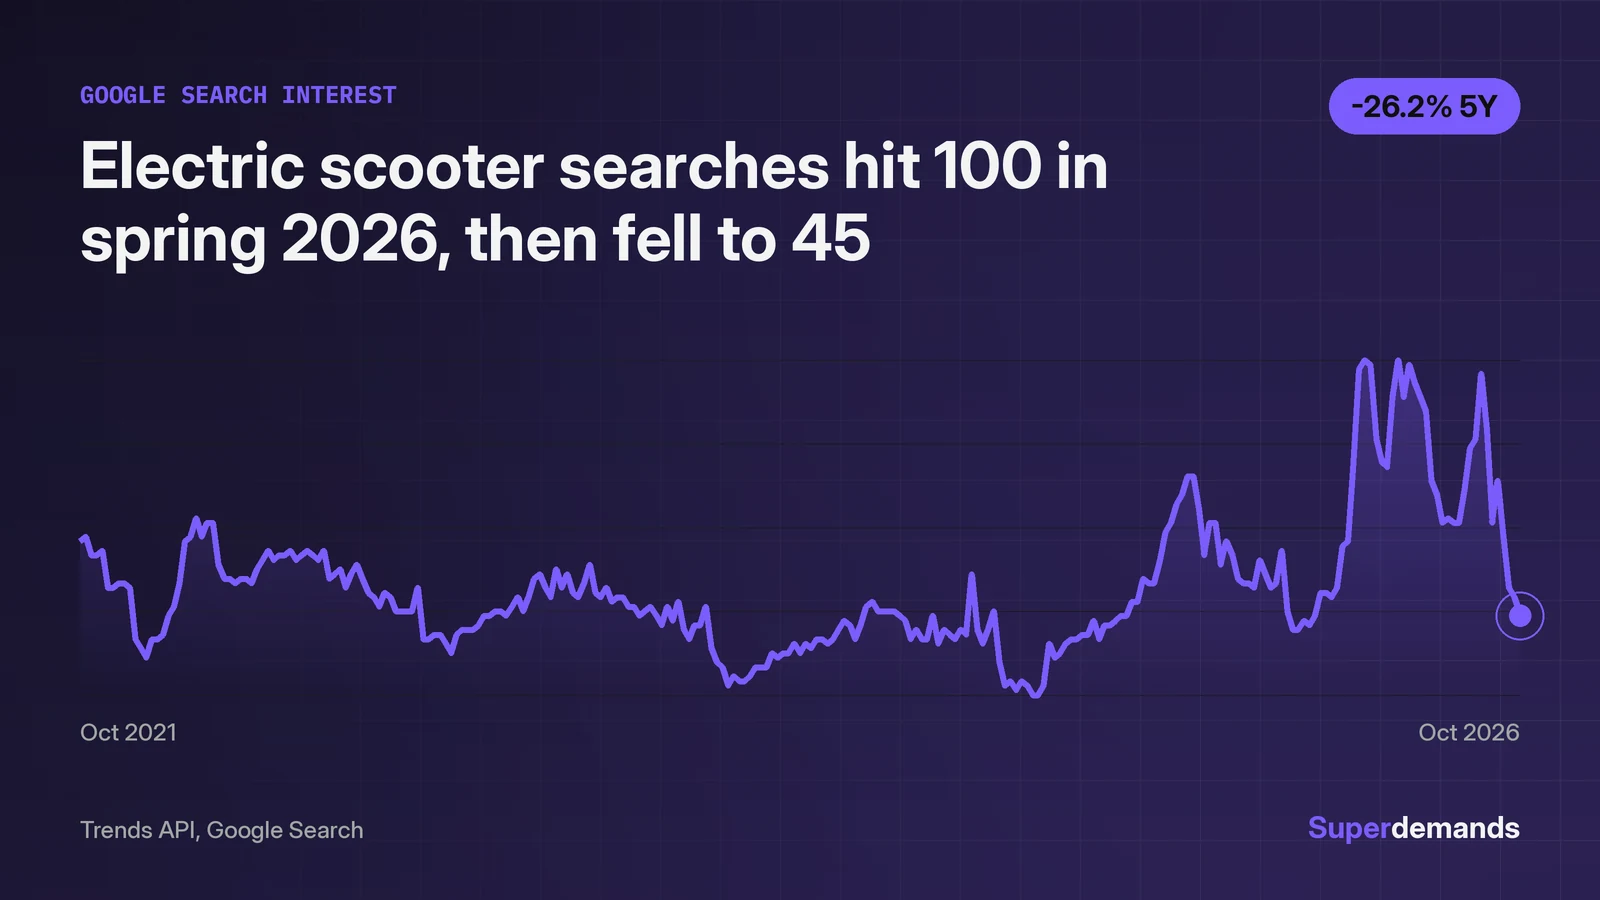
Demand for electric scooters is not rising on a five-year view, but the recent past is stronger than the long-run trend suggests. Google search interest stood at 45 on a 0 to 100 index in the week of 24 October 2026, down 26.2% from 61 five years earlier and down 22.4% from a year earlier. The longer record complicates that picture. Search interest averaged 70.3 across 2026 so far, the highest yearly average in five years, after reaching the maximum index value of 100 in April and May. Amazon search volume follows the same shape: a strong spring, a sharp autumn fall, and a 2026 average still above every year before 2025. The short answer is that demand surged in spring 2026, faded with the season, and sits on a five-year trend that is flat to down rather than climbing.
The five-year trend points down, not up
Across five years, Google search interest in electric scooters has drifted down, not up. The series covers 261 weekly points from 30 October 2021 to 24 October 2026. It opened at 61, with an estimated volume of 1,391,028 searches, and the latest point is 45, with an estimated volume of 1,026,168 searches. That is a 5-year change of 26.2% down, and a 3-year change of 4.3% down, from 47 in October 2023. Over two years the picture is slightly positive, up 7.1% from 42 in October 2024, which shows how much the answer depends on the two dates chosen.
Yearly averages tell a steadier story. Interest averaged 56.0 in the nine weeks of 2021 in the series, then 52.6 in 2022, 46.3 in 2023 and 40.0 in 2024, before recovering to 48.6 in 2025 and 70.3 in the 43 weeks of 2026 available. The decline ran through 2024, and the recovery is recent. One caveat belongs up front: the exact phrase "electric scooter demand" draws only about 10 searches a month, so this piece measures demand through searches for "electric scooter" itself. The volumes here are estimates derived from the index, not counted searches. Readers who want the mechanics can read how the 0 to 100 index is built, and the broader set of vehicle topics sits in the autos and vehicles category.
Spring 2026 set the five-year record
Spring 2026 produced the strongest electric scooter demand in the five-year record. The index hit 100 in the weeks of 11 April and 23 May 2026. Nine spring weeks reached 90 or above:
| Week ending | Index |
|---|---|
| 4 April | 98 |
| 11 April | 100 |
| 18 April | 99 |
| 16 May | 92 |
| 23 May | 100 |
| 30 May | 92 |
| 6 June | 99 |
| 13 June | 95 |
| 20 June | 92 |
The second quarter of 2026 averaged 91.8, against 56.5 in the second quarter of 2022, the best spring before it.
The contrast with 2025 is sharp. The 2025 peak was 75, reached in the weeks of 30 August and 6 September. No week in 2025 reached 80, let alone the spring 2026 highs of 92 to 100. The data shows the move, not the reason: nothing in the search series says what caused the spring surge, whether new models, price cuts, weather or something else. What the data does show is that the surge was sustained for a full quarter rather than a single week, which is what separates it from a one-day spike.
The autumn fall is steep, but autumn still beat last autumn
The drop from the spring peak is steep, yet the autumn level remains above the same months last year. Google search interest fell 45.8% in six months, from 83 in the week of 25 April 2026 to 45 in the week of 24 October, and 31.8% in three months, from 66 in the week of 25 July. The autumn readings tell the story:
| Week ending | Index |
|---|---|
| 5 September | 97 |
| 12 September | 85 |
| 19 September | 65 |
| 26 September | 74 |
| 3 October | 62 |
| 10 October | 51 |
| 17 October | 49 |
| 24 October | 45 |
That fall fits the usual shape of the year. The third quarter is the strongest quarter in every full year of the record, 57.1 in 2022, 50.1 in 2023, 44.1 in 2024 and 63.3 in 2025, and the first quarter is the weakest: 47.6 in 2022, 41.1 in 2023, 33.7 in 2024 and 32.5 in 2025. Spring 2026 broke that pattern: the second quarter averaged 91.8, above the third quarter's 74.1. On a like-for-like basis, September to October 2026 averaged 66.0 across the eight weeks available, against 63.3 in the same eight weeks of 2025. The index has also recovered from lower readings before: it bottomed at 28 in February 2025 and reached 75 by late August that year. This suggests the autumn fall is seasonal, but it does not prove a recovery will follow. Readers tracking nearby transport topics can compare with the travel and transportation category.
Amazon shows the same shape, plus a holiday peak
Amazon search volume follows the same arc as Google, with one difference: its largest spike came at the end of November. The Amazon series holds 52 monthly points from July 2022 to October 2026. It peaked at 100 on 30 November 2025, with an estimated volume of 4,132,335 searches, the largest monthly volume in the record. By 31 October 2026 it had fallen to 48.6, with an estimated volume of 2,010,035 searches.
Growth on Amazon is negative on every window the data supports: down 25.8% over 12 months, down 35.8% over 6 months, down 23.0% over 24 months and down 2.8% over 36 months. A 5-year figure is not available because Amazon history covers only about four years. Yearly averages run 48.5 in 2023, 58.9 in 2024, 64.2 in 2025 and 60.4 across the ten months of 2026, so the shopping side of demand was still rising through 2025. Spring 2026 on Amazon ran 75.7 in April, 75.6 in May and 80.5 in June, then 66.3 in July, 60.7 in August, 60.1 in September and 48.6 in October. The November peak points to gift buying, but the data shows the timing, not the motive behind it. Tesla offers a useful contrast as another electric vehicle topic tracked on this site.
YouTube interest moved the other way
YouTube search interest in electric scooters rose while Google search fell. On YouTube, interest is up 10.8% over 12 months, from 74 in October 2025 to 82 in October 2026, up 49.1% over 24 months, from 55 in October 2024, and up 12.3% over five years, from 73 in October 2021. All three windows end in the week of 24 October 2026, the same date as the Google figures, so the split is a like-for-like comparison.
The two sources measure different behaviour: typed search on Google against video search on YouTube. The data shows a split, not a reason for it. One reading is that people are still researching scooters through video even as plain search cools; that is a suggestion, not a finding, and it would need viewing or sales data to confirm. What can be said plainly is that interest has not vanished from every channel at once.
Will demand last?
The evidence supports durable interest, not durable growth. Five years of Google search point down 26.2%, yet 2026 so far has the highest yearly average on record at 70.3, and that average is likely to fall once the seasonally low November and December weeks enter the record. Amazon yearly averages rose from 48.5 in 2023 to 64.2 in 2025, and YouTube interest is up over 12 months, 24 months and five years. No single source tells a clean story of a market in steady climb, and no single source tells a clean story of a market in collapse either.
Three limits matter. Search interest is not sales, and none of the figures here are sales or shipment data. The volumes are estimates derived from the index. Amazon history covers only about four years, so its long-run view is shorter than Google's. The test that settles the question is spring 2027: if search interest returns to the 90s, 2026 may mark a higher plateau; if it peaks near 60, 2026 reads as an outlier year.